Guide to universal design in Excel
Universal design in Excel documents means, for example, the way tables, pictures and text are designed. It is easy to end up with a lot of information, which is why it is important to keep things simple.
Tables
It is difficult for people with impaired vision to acquire information in tables. You should therefore try to avoid using tables if you can communicate the information in a different way.
If you must use tables, you can follow these tips:
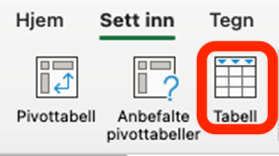
- Use the inbuilt table tools. To create a table, click “Insert”, select “Table” and highlight the cells you want to include. If you have already created the headers, click “My table has headers”.
- If you make a table by only highlighting a set of cells with borders, Excel will not provide enough information about the table when aids such as screen readers are being used.
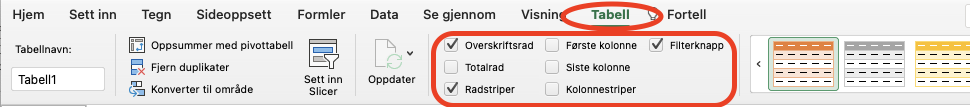
- You can also make table headers by selecting “Header row”. Then enter the headings in the top row. This allows people using screen readers to identify rows and columns.
- Dividing big tables into multiple small tables will make the content easier to read.
- Use a table style with a strong colour contrast. You can do this by first clicking the cursor anywhere in the table. Then click on “Table” in the toolbar, and select the style you want to use. There must be a good contrast between text and background. Banded rows make tables easier to navigate.
- Avoid empty cells, columns or rows. If someone is navigating a table using the keyboard, an empty cell, row or column could indicate to them that there is no more information in the table.
-
- If you cannot avoid an empty cell, row or column, you can enter text explaining that the cell is empty. For example, “N/A” or “Intentionally blank”. You can write these in the same colour as the background colour, so that they are not visually disruptive.
- Avoid splitting or merging cells, since screen readers keep track of location by counting cells. If you merge cells, it becomes extremely difficult, if not impossible, for a screen reader to obtain information from the table.
Using pictures, illustrations, figures and SmartArt graphics
- Enter alternative text which describes the picture/illustration and its context in 1–2 sentences. This makes the content available to people who use aids such as screen readers.
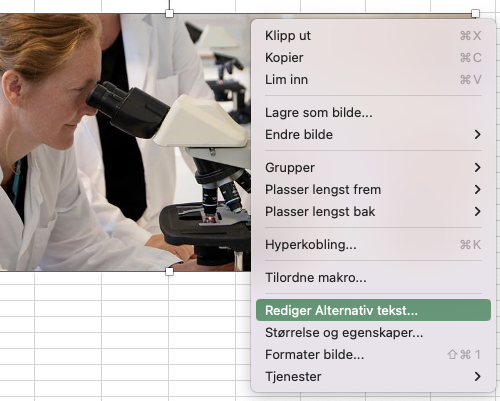
- You can enter and edit alternative text by right-clicking on the picture/figure/illustration and selecting “Edit Alt Text”.
- Remember that a good alternative text includes the most important information, is relatively brief and describes the theme of the picture.
- Pictures used as decoration are labelled “decorative pictures”, which means that they do not need alternative text.
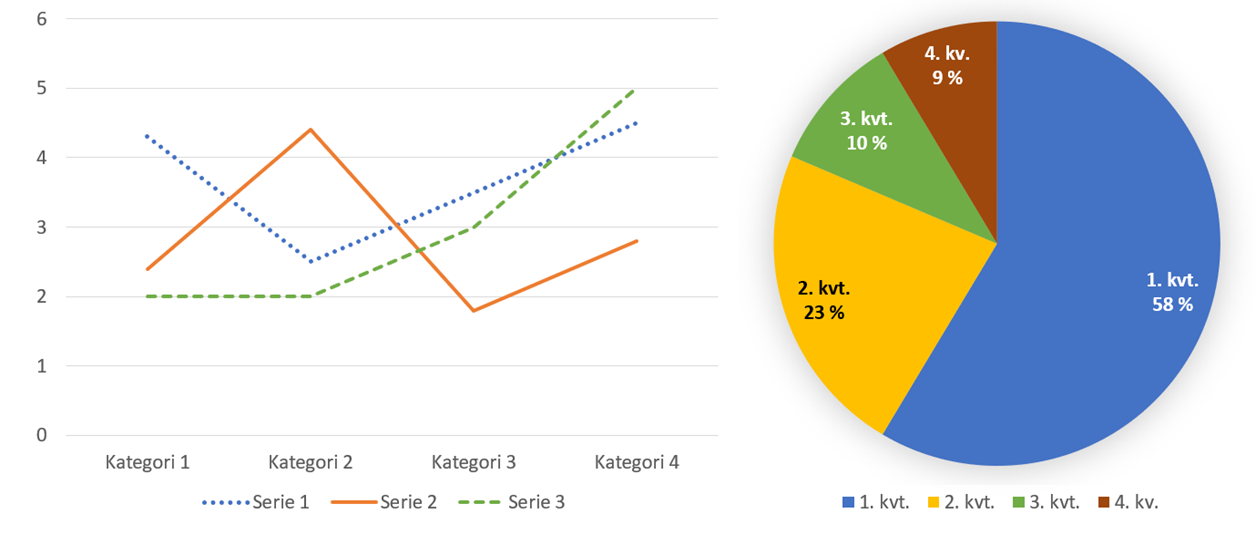
- If you use diagrams, the alternative text should briefly present the purpose and main information in the diagram. You should also present the values in the diagram.
- Illustrations such as diagrams are often designed with colours to convey information. It may be appropriate here to remember that colour-blind people or people with colour vision deficiency find it difficult to differentiate between certain colours. It is therefore important to use means other than only colour to convey the information.
Using pivot tables
- Enter alternative text and title. You can do this by right-clicking and selecting “Alternatives for pivot tables” and then selecting “Alternative text”. Enter the title in the title box. In the “Description” box, enter 1–2 sentences which describe the table and its context.
Using links/hyperlink text
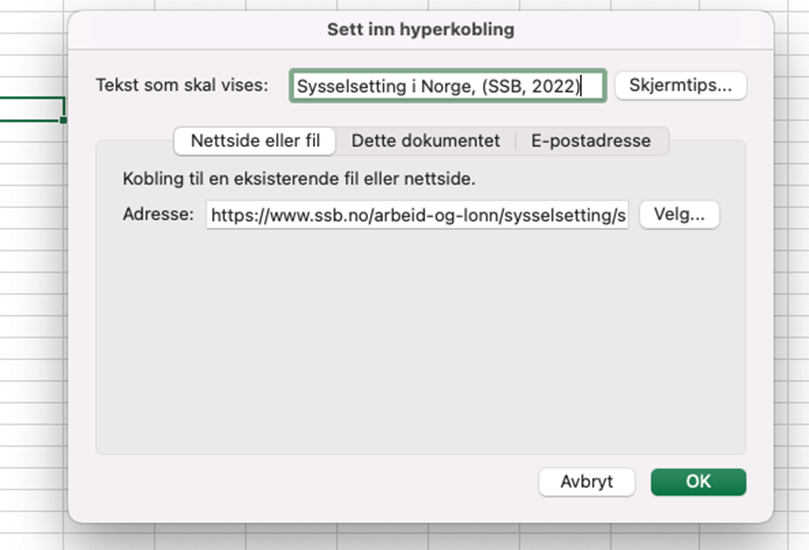
- Links should be descriptive and inform the reader where they are taking them.
- Right-click in the cell where you want to insert the link. Select “Link”. Enter descriptive link text in the “Text to display” box. Enter the website address in the address box. Afterwards, test that the hyperlink works. Remember “www.”
Start in cell A1
- A screen reader tool starts by reading from A1. This is why use should start entering text here, for example the title of a table.
- If the spreadsheet contains a lot of information, you can write instructions or a summary of the content of the sheet directly in cell A1, such as information about the order of the content. This can make it easier for people who use screen readers to navigate in the spreadsheet.
Headings of sheets
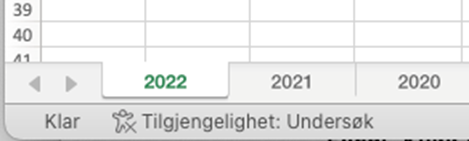
- Right click on the sheet tab (at the bottom left of the screen) and select “Rename”. Enter a brief and unique name, making the sheet easy to find and recognise.
- Delete sheets that are not necessary. Right-click on a sheet and select “Delete”.
General tips
- Check accessibility while you work by using the accessibility checker. This gives you information about whether the file is accessible, or whether you must inspect the document. You can find this function at the bottom left, or by searching in the “Help” menu in the toolbar at the top.
- Make sure that the font size is no smaller than 11.
- Use a font that is easy to read, such as Arial or Calibri.
- Avoid block capitals/CAPS LOCK and the excessive use of italics and underlining.
- To highlight headings, use bold font or larger font than the rest of the text in the spreadsheet, which will create structure in the spreadsheet.
- Be careful when using colours. Check that the colour contrast is adequate by using the “Accessibility checker”. Some people have problems differentiating between colours. If you are conveying information using colour, make sure that you also convey this information in other ways.
- If you cannot find the function for what you want to do, you can look in the Excel toolbar. Click on “Help” and enter a keyword describing what you are looking for.